Dimensions
You can add Dimensions to your data items by adding key-value attributes.
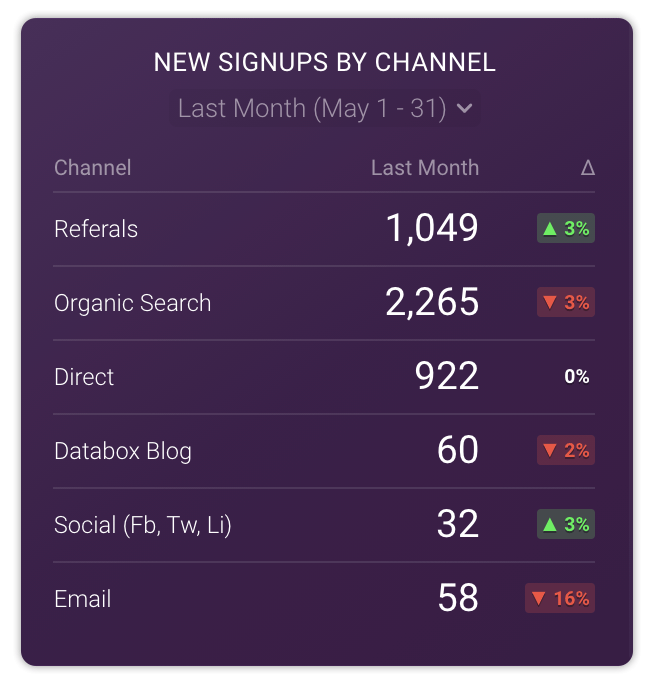
In the example below, we’ve split the metric based on the Dimension ‘Channel’
- cURL
- PHP
- JavaScript
- Java
- Go
- Python
- C#
curl https://push.databox.com/data \
-u <your_token>: \
-X POST \
-H 'Content-Type: application/json' \
-H 'Accept: application/vnd.databox.v2+json' \
-d '[
      {
        "key": "sales",
        "value": 8300,
        "attributes": [{"key": "channel", "value": "online"}]
      },
      {
        "key:": "sales",
        "value": 4000,
        "attributes": [{"key": "channel", "value": "retail"}]
      },
      {
        "key" : "sales"
        "value": 1230,
        "attributes": [{"key": "channel", "value": "in-person"}]
      },
     {
        "key": "costs",
        "value": 4567,
        "attributes": [{"key": "channel", "value": "in-person"}]
     }
  ]'
<?php

require_once __DIR__ . '/../../../vendor/autoload.php';

use Databox\Api\DefaultApi;
use Databox\ApiException;
use Databox\Configuration;
use Databox\Model\PushData as DataboxPushData;
use GuzzleHttp\Client;

execute();

function execute()
{
    // Configure HTTP basic authorization: basicAuth
    $config = Configuration::getDefaultConfiguration()
        ->setHost('https://push.databox.com')
        ->setUsername('<your_token>');

    $headers = [
        'Content-Type' => 'application/json',
        'Accept'       => 'application/vnd.databox.v2+json'
    ];

    $apiInstance = new DefaultApi(
        new Client(['headers' => $headers]),
        $config
    );

    try {
        $apiInstance->dataPost([
            (new DataboxPushData())
                ->setKey('sales')
                ->setValue(8300)
                ->setAttributes(['channel' => 'online']),

            (new DataboxPushData())
                ->setKey('sales')
                ->setValue(4000)
                ->setAttributes(['channel' => 'retail']),

                (new DataboxPushData())
                ->setKey('sales')
                ->setValue(1234)
                ->setAttributes(['channel' => 'in-person']),
        ]);

        echo "Successfully pushed data to Databox";
    } catch (ApiException $e) {
        echo 'Exception when calling DefaultApi->dataPost: ' . $e->getMessage() . PHP_EOL . $e->getResponseBody() . PHP_EOL;
    }
}
import {
  ApiResponse,
  Configuration,
  DataPostRequest,
  DefaultApi,
} from "databox";

const config: Configuration = new Configuration({
  basePath: "https://push.databox.com",
  username: "<your_token>",
  headers: {
    Accept: "application/vnd.databox.v2+json",
  },
});

const dataPostRequest: DataPostRequest = {
  pushData: [
    {
      key: "sales",
      value: 8300,
      attributes: [
        {
          key: "channel",
          value: "online"
        }
      ],
    },
    {
      key: "sales",
      value: 4000,
      attributes: [
        {
          key: "channel",
          value: "retail"
        },
      ]
    },
    {
      key: "sales",
      value: 1230,
      attributes: [
        {
          key: "channel",
          value: "in-person"
        },
      ]
    }
  ],
};

const api = new DefaultApi(config);

try {
  api
    .dataPostRaw(dataPostRequest)
    .then((response: ApiResponse<void>) => response.raw.json())
    .then((responseBody) => {
      console.log("Response data", responseBody);
    });
} catch (error) {
  console.log("Error: ", error);
}
import org.databox.ApiClient;
import org.databox.ApiException;
import org.databox.Configuration;
import org.databox.api.DefaultApi;
import org.databox.auth.HttpBasicAuth;
import org.openapitools.client.model.PushData;

import java.util.List;

public class PushDataExample {
    public static void main(String[] args) {
        ApiClient defaultClient = Configuration.getDefaultApiClient();
        defaultClient.setBasePath("https://push.databox.com");
        defaultClient.addDefaultHeader("Accept", "application/vnd.databox.v2+json");

        HttpBasicAuth basicAuth = (HttpBasicAuth) defaultClient.getAuthentication("basicAuth");
        basicAuth.setUsername("<your_token>");

        DefaultApi apiInstance = new DefaultApi(defaultClient);

        try {
            apiInstance.dataPost(List.of(
                new PushData()
                    .key("sales")
                    .value(8300)
                    .attributes(List.of(new PushDataAttribute().key("channel").value("online"))),

                new PushData()
                    .key("sales")
                    .value(4000)
                    .attributes(List.of(new PushDataAttribute().key("channel").value("retail"))),

                new PushData()
                    .key("sales")
                    .value(1234)
                    .attributes(List.of(new PushDataAttribute().key("channel").value("in-person")))
            ));
        } catch (ApiException e) {
            e.printStackTrace();
        }
    }
}
package main

import (
  "context"
  "fmt"
  "os"
  "time"

  databox "github.com/databox/databox-go/databox"
)

const t = "<your_token>" // Your Databox token

func main() {

  // Create a context with basic auth
  auth := context.WithValue(context.Background(), databox.ContextBasicAuth, databox.BasicAuth{UserName: t})

  // Create a configuration
  cfg := databox.NewConfiguration()
  cfg.DefaultHeader["Content-Type"] = "application/json"
  cfg.DefaultHeader["Accept"] = "application/vnd.databox.v2+json"

  // Create an API client
  api := databox.NewAPIClient(cfg)

  // First PushData object with a dimension channel attribute set to online
  a1 := databox.NewPushDataAttribute()
  a1.SetKey("channel")
  a1.SetValue("online")

  var attributes1 []databox.PushDataAttribute
  attributes1 = append(attributes1, *a1)

  data1 := databox.NewPushData()
  data1.SetKey("sales")
  data1.SetValue(8300)
  data1.SetAttributes(attributes1)


  // Second PushData object with a dimension channel attribute set to retail
  a2 := databox.NewPushDataAttribute()
  a2.SetKey("channel")
  a2.SetValue("retail")

  var attributes2 []databox.PushDataAttribute
  attributes2 = append(attributes2, *a2)

  data2 := databox.NewPushData()
  data2.SetKey("sales")
  data2.SetValue(4000)
  data2.SetAttributes(attributes2)

  // Push the data (send both PushData objects)
  r, err := api.DefaultAPI.DataPost(auth).PushData([]databox.PushData{*data1, *data2}).Execute()
  if err != nil {
    fmt.Fprintf(os.Stderr, "Error when calling `DefaultAPI.DataPost``: %v\n", err)
  }

  fmt.Fprintf(os.Stderr, "Full HTTP response: %v\n", r)
}
# Configuration setup for the Databox API client
# The API token is used as the username for authentication
# It's recommended to store your API token securely, e.g., in an environment variable
configuration = databox.Configuration(
    host="https://push.databox.com",
    username="<your_token>",
    password=""
)

# It's crucial to specify the correct Accept header for the API request
with databox.ApiClient(configuration, "Accept", "application/vnd.databox.v2+json", ) as api_client:
    api_instance = databox.DefaultApi(api_client)

    # Define the data to be pushed to the Databox Push API# Prepare the data you want to push to Databox
    push_data = [
        {
            "key": "sales",
            "value": 8300,
            "attributes": [{"key": "channel", "value": "online"}]
        },
        {
            "key": "sales",
            "value": 4000,
            "attributes": [{"key": "channel", "value": "retail"}]
        },
        {
            "key": "sales",
            "value": 2000,
            "attributes": [{"key": "channel", "value": "in-person"}]
        }
    ]

    try:
        api_instance.data_post(push_data=push_data)
    except ApiException as e:
        # Handle exceptions that occur during the API call, such as invalid data or authentication issues
        pprint("API Exception occurred: %s\n" % e)
    except Exception as e:
        # Handle any other unexpected exceptions
        pprint("An unexpected error occurred: %s\n" % e)
using System.Diagnostics;
using Databox.Api;
using Databox.Client;
using Databox.Model;

namespace Example
{
  public class Example
  {
    public static async Task Main(string[] args)
    {

      Configuration config = new Configuration();
      config.BasePath = "https://push.databox.com";
      config.Username = "<your_token>";
      config.DefaultHeaders.Add("Accept", "application/vnd.databox.v2+json");


      HttpClient httpClient = new HttpClient();
      HttpClientHandler httpClientHandler = new HttpClientHandler();
      var apiInstance = new DefaultApi(httpClient, config, httpClientHandler);
      var dataPostRequest = new List<PushData>() {
        new PushData()
        {
            Key = "sales",
            Value = 8300,
            Attributes = new List<PushDataAttribute>()
            {
                new PushDataAttribute()
                {
                    Key = "channel",
                    Value = "online"
                }
            }
        },
        new PushData()
        {
            Key = "sales",
            Value = 4000,
            Attributes = new List<PushDataAttribute>()
            {
                new PushDataAttribute()
                {
                    Key = "channel",
                    Value = "retail"
                }
            }
        }

      };

      try
      {
        var response = await apiInstance.DataPostWithHttpInfoAsync(dataPostRequest);
        Console.WriteLine(response.Data.ToString());
      }
      catch (ApiException e)
      {
        Console.WriteLine("Exception when calling DefaultApi.DataPostWithHttpInfo: " + e.Message);
        Console.WriteLine("Status Code: " + e.ErrorCode);
        Console.WriteLine(e.StackTrace);
      }
    }
  }
}

In Databox, you can filter and visualize your data for specific dimensions. That means you could view only retail sales, or compare sales across different channels. You can add as many dimensions as you’d like to each metric.