Metric definition
By defining a metric, you are describing what kind of values you are sending to Databox. You can send different kinds of data – from unprocessed raw numbers to current balances, averages, rates, and more.
The Metric Type defines what kind of data the Metric is storing. You can select a Metric Type for each created metric by going to the Metric Library and selecting the custom data source where you have your metric.
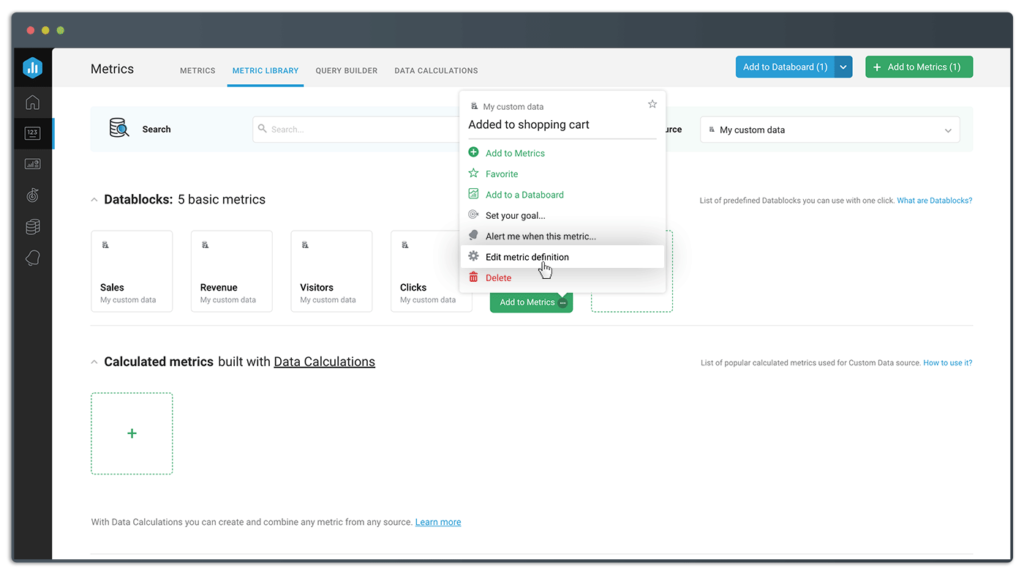
There are multiple properties in the Metric definition popup that can be customized for each custom metric.
General settings

- Name (required): set a name for your Metric, which will be visible within the Databox app.
- Description (optional): describe the data you’re sending to this Metric.
- Dimensioned/Attributed metric: by default metrics do not include dimensions. Once this parameter is set, it can’t be edited. Learn more about using Dimensions.
- Internal Metric key (required): this is the identification key used for sending data via PushAPI. Once it’s set for a metric, it can’t be edited. This field is case sensitive and you can use any alphanumeric value (a-z, A-Z, 0-9, _). To use another key, you will need to create a new custom metric.
It is possible to select an existing key and have two or more metrics created with the same internal key. This would be useful if you want to have one Token Data Source and multiple different metric definitions within it (i.e. different aggregation functions).
Data aggregation

- Data type: instruct the Databox system how to handle the data you’re sending. Read more about this setting below.
- Other settings: set whether the metric should start at 0 every day, whether future date ranges should be available, if historical is being changed, etc.
Visual preferences
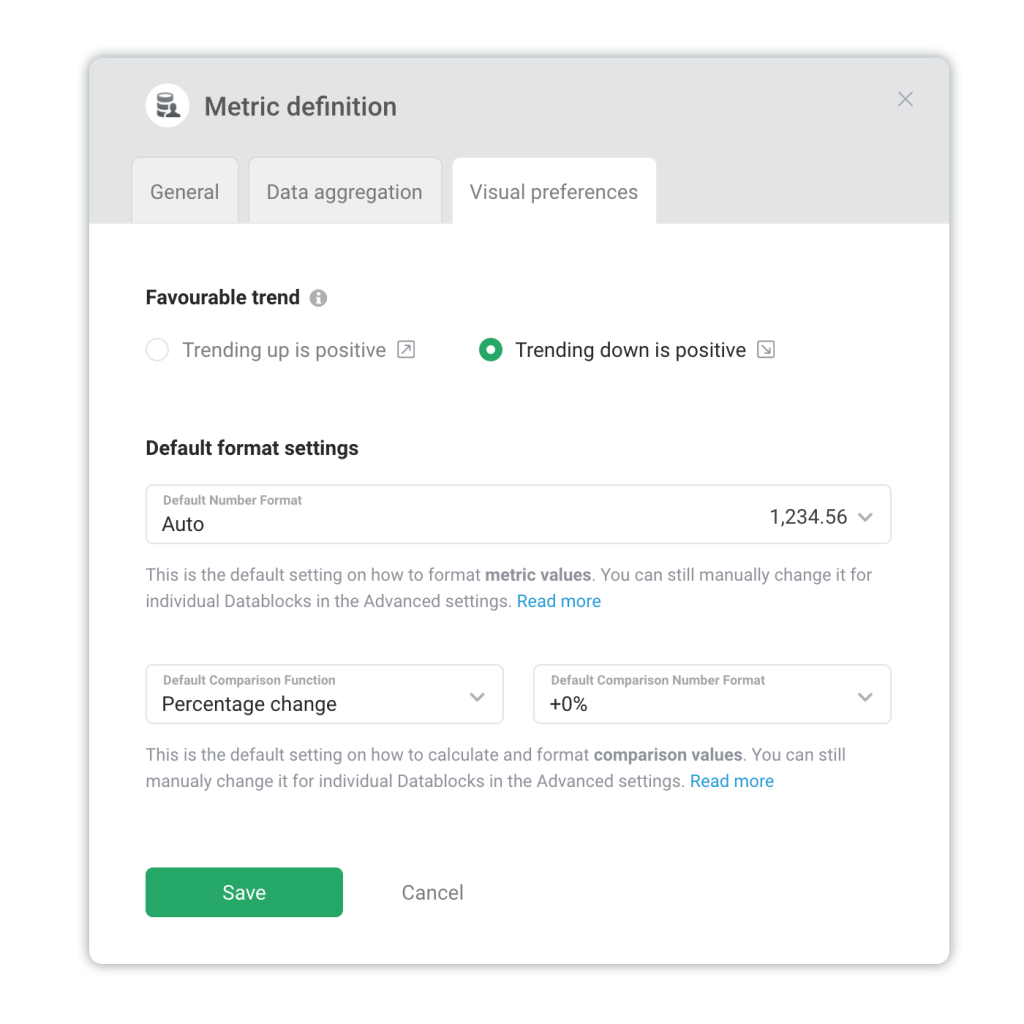
- Visual preferences: determine whether this is an Inverted metric (trending down is positive), the default number format, the change function and format, etc.
Data type use-cases
There are 3 major data types that can be sent to Databox.
Event values [default]
Aggregation function: SUM [Default], MIN, MAX, AVG, Count
Data type: All values
This function and type should be selected when you are storing individual value(s) for the metric at the specified Date/Timestamp. For longer Date Ranges with multiple data points, individual metric values will be aggregated for the entire Date Range and the aggregated value will be displayed for the metric. An example for event values is when you’re pushing single events like Sales, Views, New subscriptions, Cancellations, etc. once they happen.
You can choose from different aggregation functions for this use-case:
- SUM [default]: display the aggregated total (sum) of sent data for the Date Range.
- MIN: display the lowest (minimum) sent value for the Date Range.
- MAX: display the highest (maximum) sent value for the Date Range.
- AVG: display the average of sent data for the Date Range.
- Count: display the number (count) of sent for the Date Range.
Total/Current values
Aggregation function: Latest
Data type: All values
This type should be selected when your metric reflects the current total value for the metric. In Databox, the latest entry will always be displayed for the Metric. Examples of metrics that should have Total values selected are ‘Total Followers’ and ‘Current Account Balance’.
Period values
Aggregation function: SUM [Default], MIN, MAX, AVG, Count
Data type: Period values
Period: Hour, Day [Default], Week, Month, Quarter, Year
This type should be selected when your metric reflects the most up-to-date value for a specific period (day, month, week). In Databox, the latest entry will be taken for the specified period (i.e. Latest value for each day). For longer Date Ranges, individual metric values will be aggregated for the entire Date Range and the aggregated value will be displayed for the metric.
Example: For ‘Daily New Followers’ or ‘Daily Calls by Sales Rep’ you should select ‘SUM‘ as the aggregation function for longer Date Ranges (i.e. month), Period values type and Day as the period. The system will take the latest value for each day and sum it for longer periods (month).
Advanced aggregation settings
Start with zero (0) every day [enabled by default]
By default, metric values reset to 0 at midnight, and then increase or decrease throughout the day. However, metrics like Account Balance, Bounce Rate, Conversion Rates, etc. should not start at zero (0) each day. For such metrics, this option should be disabled.
Due to this setting, cumulative charts will not be available for the metric since summing individual values will not produce accurate results.
Show future data [enabled by default]
By default, we show future data that’s sent for a metric if a future Date Range is selected.
By disabling this option only data up to the current hour (day) will be displayed on charts in Databox. Future date ranges (Next week, Next month) will be disabled as well.
Historical data changing [enabled by default]
By default, we update historical data for past Date Ranges (i.e., Last Month, Last Quarter, etc.) in order to pick up on any changes that may have been made to historical data.
By disabling this option, all historical Date Ranges won’t be recalculated every time they are requested. Instead, we’ll store the values from the first data push in our warehouse, and won’t replace it even if new data is sent. This is done to optimize your account purposes.